ABSTRACT
Although tunnelling has gained particular importance in recent years and benefits the operation of roads, its use involves associated risks. A crucial aspect of the operation of road tunnels is fire safety. Fire incidents can evolve into catastrophic accidents. Therefore, fire incidents are considered serious events for road tunnels.
Risk assessment, which is mandatory in the UK, has been established to ensure the level of safety in tunnels. To this respect, a novel quantitative fire risk analysis model (LBAQRA) has been developed by London Bridge Associates Ltd. (LBA) to act as an add-in to traditional qualitative fire risk assessment. This model consists of two main sections: quantitative frequency analysis, to estimate the frequency of fire incidents via an event tree; and, quantitative consequences analysis, to model the consequences of fire incidents. LBAQRA covers the risk to tunnel users. The result of the risk analysis is the expected value of the societal risk of the investigated tunnel.
In the first part of this article, a brief description of tunnel fire dynamics and fire risk assessment is presented, followed by the structure and logic behind the model.
INTRODUCTION Road Tunnel Fire Dynamics
Road tunnel fires differ in many aspects from open fires and building fires. They differ from open fires in at least two important ways1: the heat feedback and the effect of natural ventilation. They also differ from building compartment fires in the ventilation factor, the flashover conditions, and stratification development, respectively.1
In road tunnel fires, additional parameters such as fire size and its position, ventilation, the tunnel slope in the vicinity of the fire, the cross-sectional area where the fire takes place, the tunnel length, the type of tunnel lining material (concrete, blasted rock), and the meteorological conditions at the entrance and exit play important roles.
When the fire plume impinges on the tunnel ceiling, the smoke flow transits to a longitudinal flow on both sides in a tunnel with essentially no longitudinal ventilation and nearly no slope. Eventually, this layer becomes thicker and descends towards the tunnel floor.
If a longitudinal ventilation system is activated, a fire that develops in a tunnel interacts with the ventilation airflow and generates complicated airflow patterns and turbulence in the vicinity of the fire. At first, on the upstream side of the fire, a smoke layer will still exist (backlayering) (see Figure 1). On the downstream side, the stratification of the smoke is gradually dispersed. This is governed by the heat losses to the surrounding walls and the turbulent mixing between the buoyant smoke layer and the opposite moving cold layer. If the resulting longitudinal flow velocity is not high enough, a reverse flow of hot gases in the ceiling will be created. This phenomenon is better known as backlayering. To prevent the backlayering, the longitudinal velocity inside the tunnel has to be higher than a critical value.
Vehicles in tunnels are in most cases the only available fuel. Tunnel fires are generally fuel-controlled as there are seldom restrictions on air access. However, in severe incidents such as the Mont Blanc, Tauern, and the St. Gotthard fire disasters,2 with multiple large vehicles involved, the supply of air was not enough to sustain complete combustion. This will result in a sudden increase in the production of carbon monoxide (CO) and all the oxygen (O2) that is transported to the fire source could be consumed. This may not be the case if only one vehicle is burning but will occur when more vehicles are involved.
Fire Risk Analysis
A framework of guidelines and regulations for the design, construction, and operation of road tunnels has been developed in many countries like the UK to address the safety of road tunnel users. Guidelines establish a certain standard level by including prescribed safety measures for tunnel categories and focusing on technical design specifications. However, the resulting safety level might differ from the unified safety level provided by guidelines and vary from tunnel to tunnel. Moreover, there are always residual risks, which are not obvious, and this shows the importance of risk analysis.
Risk analysis is a systematic approach for facilitating the examination of specific accidents and the observation of residual risks.3,4 It can improve and/ or optimise the safety level in road tunnels and subsequently, select additional safety measures if needed. Risk is related to the ‘‘expected loss or damage associated with the possibility of occurrence of the critical event or the subsequent of events’’. Therefore, risk is calculated as a product of probability of occurrence, and the severity of consequences. A quantification of risks can be achieved by combining the probability and consequences of each scenario. Risk analysis performs the systematic approach to identify the hazards and subsequently calculate the risks.
Risk analysis methods can be characterised as either one or a combination of the following5:
- Verification of compliance with prescriptive rules;
- Qualitative models (based upon knowledge, experience or systematic qualitative analysis);
- Quantitative models (QRA) include event trees, fault trees, and consequences estimation models. Individual risk, societal risk, and estimates of damage are considered outputs of QRA.
London Bridge Associates Ltd. is keen to develop knowledge in the industry and support the industry. This paper covers the first three years of an R&D project led and delivered by LBA to develop a quantitative risk analysis model for road tunnels.
LBAQRA
One of the road network’s critical infrastructures is tunnels.
Tunnels are achievable alternatives to travel through physical barriers such as water, hills and mountains. The consequences of serious tunnel incidents, like fires, are expected to be severe in terms of injuries and fatalities, tunnel structure and equipment damage, and disturbance to the traffic flow (e.g., the Mont Blanc tunnel fire in 1999 where 39 people were killed and the fire lasted longer than 50 hours). Therefore, fire safety is a matter of great importance when designing a road tunnel system.
To meet safety objectives, risk assessment has been incorporated into the safety management of road tunnels over the last 15 years. It is important to make the process of risk analysis more objective and there is a need for an appropriate risk assessment methodology to make an acceptable fire safety level. Poorly quantified safety levels can be restricted by decreasing the level of engineering judgment and carrying out quantitative risk assessments. It is important to make the risk analysis process as quantitative as possible. However, quantitative risk assessment has often not been carried out during the design stage and tunnel design has primarily been done with a prescriptive-based design approach in many countries.
Quantitative risk assessment in conjunction with qualitative risk assessment can improve safety levels of road tunnels in both design and operation.
Quantitative risk analysis is a valuable tool, although significant uncertainty originating from different influential parameters, such as tunnel users’ behaviour during evacuation and tunnel safety system reliability, presents challenges to risk assessment.
Not only there are a limited number of quantitative risk analysis models, but also national standards and guidelines specify detailed implementations, which can vary from country to country. Hence the need for an appropriate risk analysis methodology for road tunnels has brought about the R&D work by LBA to develop a tunnel fire risk analysis model, called LBAQRA.
The model has been developed to quantify the risk to tunnel users in the context of a fire hazard. The aim is for the model to act as an add-in to traditional qualitative risk assessment.
In the LBAQRA model, the risk assessment analysis is divided into two parts: Quantitative Frequency Analysis; and Quantitative Consequence Analysis,. The two methods of analysis are explained below:
The Quantitative Frequency Analysis lens
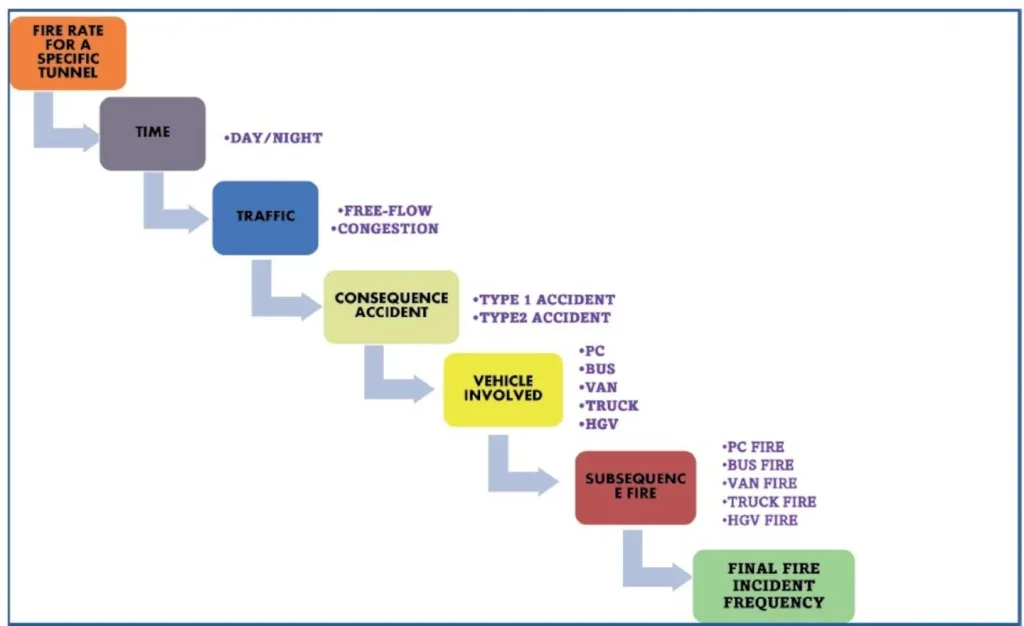
The frequency of defined accident scenarios is calculated via an event tree. The first column of the frequency event tree is the initial fire frequency in UK road tunnels, which was not available when we started developing this event tree, and was the first challenge. Incident rates vary between tunnels depending on factors such as country, location, geometry, etc. In most cases, it is challenging to use global data, which is why corrections and local rates, if possible, ought to be performed.
To derive this rate, we collected the historical statics of fire incidents in UK road tunnels from National Highways, Transport for London (TfL), and Fire & Rescue Service for the year 2021 and earlier. The period considered for analysis for each tunnel depended on the available data and the number of years that the tunnel had been in operation. The average period was 10 years. Eventually, fire incident records of 38 road tunnels on rural and urban roads were collected, which covers 83% of all England road tunnels. The tunnels have a length of between 156m and 3260m and a total of 1,710,793 veh/km traffic density, which shows that this database is strong enough. These were all the available fire incident data for road tunnels in England at the time of writing this article.
Then this initial fire rate is updated by considering the length, traffic volume, and gradient of tunnel under study.
It is reported that short tunnels exhibit higher crash rates, and the accident rate decreases as the tunnel lengthens. Amundsen and Ranes6 showed that the accident rates decrease as the AADT (annual average daily traffic) is greater. DARTS7 established an estimation model for fire rates dependent on tunnel length and traffic density, which are used in the LBAQRA frequency event tree to update the initial fire rate for a specific tunnel. Collision rates are higher in tunnels with a high gradient. The corrective gradient factors determined in are used to derive the fire rate for the tunnel under study.8
Drivers’ eye movement and driving performance are different during day and night, the accident rate and consequently the fire rate are different day and night. Therefore, the next influential factor in the frequency event tree is ‘The Time of the Incidents’, the second column. In the following, as the fire rate is varied by traffic conditions, i.e., accident rate in congestion is more than in free-flow traffic, traffic condition effect on fire rate is taken into account by considering the congested hours of the under-study tunnel, the third column.
Furthermore, two accident types were considered in this model, the fourth column. Incidents that include one vehicle are Type 1 and collisions that include more than one vehicle are Type 2. The probability of Types 1 and 2 incidents is derived from UK road data. The fifth column is ‘Vehicle Type’. The share of passenger cars, buses, vans, HGV, and trucks involved in fire incidents based on the tunnel fire data in PIARC 19999 and the traffic composition of the studied tunnel is considered.
The final fire frequency is calculated by multiplying the fire rate for the tunnel under study by the columns below:
- Time of fire incident (Day/Night);
- Traffic condition (Congestion/Free flow);
- Accident type (Type 1/Type 2);
- Vehicle type.
The Quantitative Consequence Analysis lens
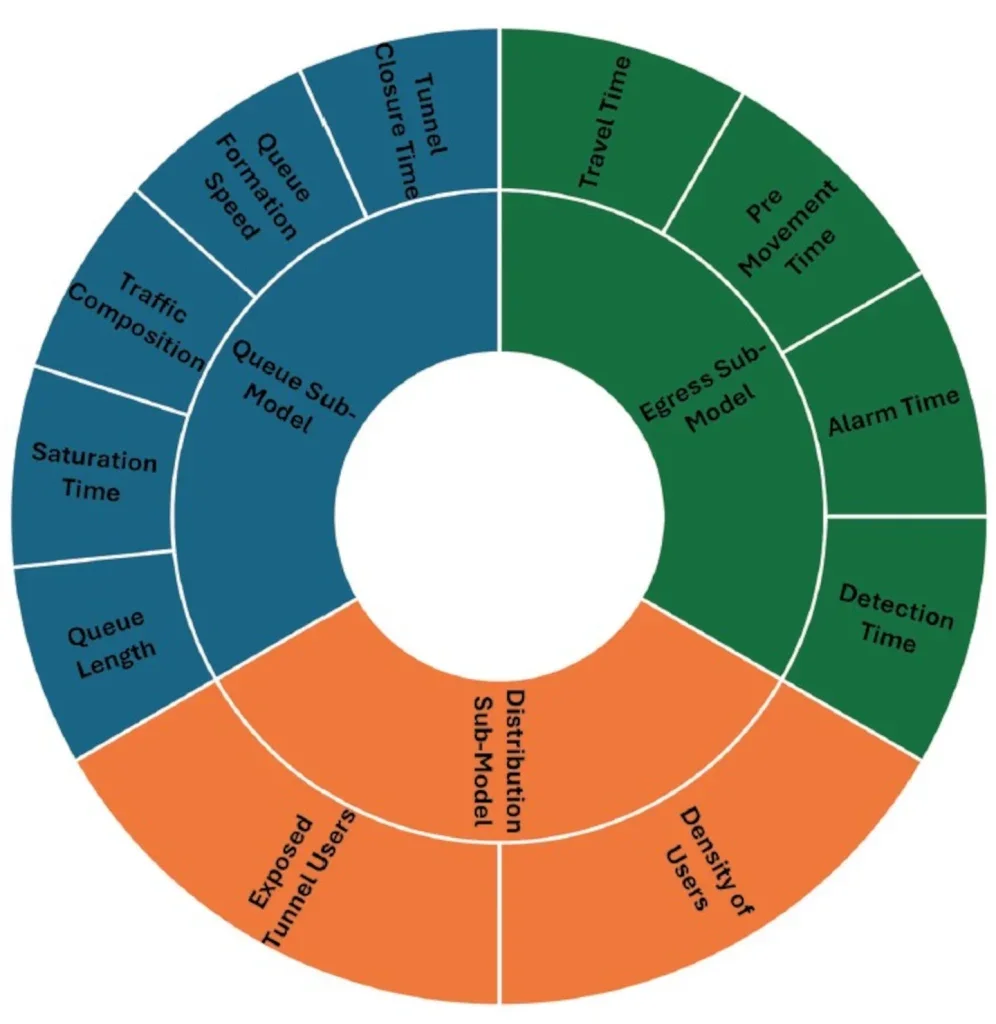
The Quantitative Consequence Analysis calculates the number of casualties. In each scenario studied in this section a set of variables are considered, including tunnel geometry and infrastructures, different combinations of fire safety equipment, traffic density and composition, and various management procedures such as emergency ventilation strategies. The analysis comprises three parts: queue model, distribution model, and egress model. These are discussed below.
When a fire happens, vehicles queue behind the fire. The number of vehicles queueing in each lane and consequently the number of exposed tunnel users is calculated by taking into account tunnel closure time, queue formation speed, stopping distance between vehicles in the queue, fire source location, and the density of stopped vehicles in each lane.
The exposed tunnel users are distributed in the queue homogeneously in the distribution sub-model. In this sub-model, the agents’ gender is considered and both the longitudinal and lateral evacuation distances are calculated.
The egress sub-model is a four-stage evacuation process, a timeline model. Detection time depending on the detection system is the first stage. The second stage, the alarm stage, which is calculated considering the influence of provided safety systems in the tunnel, such as smoke/ fire detection system and video/ radar incident detection system. Detection and alarm times are followed by the pre-movement time, including recognition time, response time, and the time to exit the vehicle.
Considering the effect of people’s reactions on each other and the smoke spread, people stuck behind the fire in the queue can be divided into three groups: direct accident witnesses; people out of the crash zone with no knowledge of the incident; and, those who are out of crash zone, influenced by escaping people.
In the last stage, travelling time is calculated by an innovative approach considering the influence of local toxic, thermal and visibility conditions on the walking speed10. The required safe egress time (ASET) is calculated by summing the times of these four stages.
Detailed smoke propagation and evacuation simulations are used to estimate the damage resulting from fires. If the mutual interaction between all influential factors is considered, a high level of accuracy can be achieved by Computational Fluid Dynamics (CFD) simulation. A three-dimensional CFD simulation (by FDS) is used to measure the fire consequences, such as temperature, heat and toxic gas concentrations at human height along the egress route. Design fires for the passenger car, bus, and HGVs were created by comparison of the experimental design fire data points recreated from experimental fire studies.
A distinction is also made between fires with fast and slow fire progression. For each fire scenario simulated by FDS, a one-dimensional longitudinal airflow model, developed in-house by LBA, is implemented to use the transient development of airflow velocity as a boundary condition in FDS. The survivability of evacuees is determined by calculating ‘Fractional Effective Doses’ (FED) concerning asphyxiation and hypothermia, the ‘Fractional Incapacitation Concentration’ (FIC), and comparison between the evacuation time (RSET) and the time when the tenability thresholds exceed their limits (ASET). The number of injuries is calculated by considering temperature as a threshold. Moreover, fire spread from the initial vehicle to adjacent vehicles causes casualties as well. The amount of radiation flux is measured at the location of each vehicle in the queue to find out whether the fire spread to them or not and the number of casualties regarding the spread of the fire is calculated.
The number of vehicles with battery-electric drives in road traffic has increased noticeably in recent years, which increases the frequency of accidents on open roads and in tunnels involving these vehicles. As a result, fire scenarios including Battery Electric Vehicles (BEV) and Electric buses are also included in LBAQRA.
Testing and Results
The results of LBAQRA can be presented as a societal risk, which is determined as a combination of event frequency and consequences. This risk is usually represented by the F-N curve. Sensitivity analysis is also another way to present the results. Modelling a fire scenario deterministically affects the risk assessment process, and questions arise about the accuracy of the results, which can be evaluated by sensitivity analysis carried out with LBAQRA. This model can also be used to test the modifications on the functionality of tunnel safety measures and emergency strategies.
LBAQRA was tested on five UK road tunnels with lengths between 315m and 1800m and daily traffic between 18300 veh/day and 46900 veh/day
Sustainability
In this model, a new approach is applied to select fire risk analysis scenarios. Both consequences and frequency of scenarios are taken into account to choose appropriate scenarios, a risk-based approach. If only the worst-case scenarios are considered (considering the consequence of a fire incident), conservatism can go too far and lead to larger, more costly, and carbon-intensive fire safety systems such as ventilation. But reduced fire size scenarios, selecting scenarios with lower fire size but with higher frequency, can lead to, for example, a drop in the required airflow to be delivered by the tunnel ventilation system and consequently, reduce the embodied carbon, leading to a more sustainable, wiser either design or refurbishment project.
In other words, a risk-based approach to hazardous natures of fires can allow for less conservative design fire loads and assessing, consequently increasing the level of passengers ‘safety via an efficient, reliable, low carbon footprint process.
AWARDS AND ACHIEVEMENT
The results of this model were published as in the Fire Journal, Modern Transportation Journal, and Global Journal of Science Frontier Research, as noted in the references.
Case study results were also published in the 19th International Symposium on Aerodynamics, Ventilation and Fire in Tunnels (ISAVFT 2022) proceedings and the 12th Tunnel Safety and Ventilation (2024) proceedings.
LBA was shortlisted for the Road Tunnel Safety Award for the quantitative risk analysis model for road tunnels in the UK (LBAQRA).
CLOSING REMARK
Quantitative risk analysis facilitates more objective decision-making risk assessment, prioritises risks, and identifies preventive measures. This vision encouraged LBA to develop a novel risk-based quantitative risk analysis model, LBAQRA. This socio-economic and quality perspective balance risk analysis model allows a structured, harmonised and transparent assessment of risks for a specific tunnel considering the relevant influence factors, including safety systems and connections between the physical environment and human behaviour. The best additional safety measures can be determined and a comparison between various measures can be implemented by LBAQRA. Continuous adaptation of the model based on the latest research leads to continual model improvement and enhances its accuracy and relevance over time.
LBA is keen to further explore the opportunity to work with clients to utilise the knowledge gained through the development of this model.
ACKNOWLEDGEMENT
This R&D project was carried out by London Bridge Associates Ltd.
REFERENCES
- Ingason, H. (2005). Fire dynamics in tunnels.
- GB, S.I. (2008). Fire resistance tests-Elements of building construction-Part 1: General requirements.
- Beard, A. and Carvel, R. eds. (2012). Handbook of tunnel fire safety. ICE publishing.
- Bjelland, H. and Aven, T. (2013). ‘Treatment of uncertainty in risk assessments in the Rogfast road tunnel project’. Safety Science, 55, pp.34-44.
- Beard, A. and Cope, D. (2007). Assessment of the Safety of Tunnels.
- Amundsen, F.H. and Ranes, G. (1998). ‘Traffic accidents and car fires in Norwegian road tunnels’. Safety in road and rail tunnels (Nice, 9-11 March 1998) (pp. 3-13).
- Identification and quantification of hazards – fire and smoke DARTS R4.4, 2004
- PIARC, 2017. Experience with Significant Incidents in Road Tunnels http://www.piarc.org
- PIARC 1999, Fire and Smoke Control in Road Tunnels. 1999
- Truchot, B., Willmann, C. and Guivarch, J. (2018, November). People evacuation in tunnel fires: a cross evaluation of two methodologies. Journal of Physics: Conference Series (Vol. 1107, No. 7, p. 072004). IOP Publishing.
Publication of Testing and Results
- Fire Journal – https:// www.mdpi.com/2571-6255/6/2/65
- Modern Transportation Journal – https://ojs.usp-pl.com/index.php/MT/article/view/8855
- Global Journal of Science Frontier Research: I Interdisciplinary – https://globaljournals.org/GJSFR_Volume23/5-Designand-Implementation.pdf
- 19th International Symposium on Aerodynamics, Ventilation and Fire in Tunnels (ISAVFT 2022) proceedings
- 12th Tunnel Safety and Ventilation (2024) proceedings.