Only man entry tunnels and sewer structures are included in Stuva’s statistics i.e. those with a minimum excavated diameter of 1m or a minimum cross section of roughly 1m2. However, some recent small trenchless headings, that have been constructed in conjunction with collector sewers or for pipe-jacking beneath rail and road facilities, have not been taken into account. Table 1 provides a picture of the overall tunnelling works at the end of the year 2000 in terms of length and the related construction volume.
When comparing transport tunnels with utility tunnels, information on the excavated volumes makes it easier to estimate the actual extent of the pertinent measurements of the tunnels. When compiling excavation volumes, the following should generally be observed: whereas excavated volumes for trenchless methods speak for themselves and can be obtained with little doubt, in cut and cover tunnelling a comparative value can be obtained; by deducting the amount of soil required for refilling from the entire amount of soil that was extracted.
If one considers the data relating to excavated volume, there is a length related ratio of approximately 8:1, against a volume related ratio of roughly 152:1, when comparing transport tunnels with supply and disposal tunnels.
The following figures come from a survey conducted in December 2000, they are presented in various ways in order to obtain the most up-to-date overview of tunnelling in Germany. The length-related share of trenchless construction for urban rail tunnels amounted to almost 7.2km at the end of 2000, roughly 64% of the national overall tunnel construction volume (roughly 70% the previous year). Approximately 6km of this or around 83% was accounted for by shotcreting methods (almost 49%, the previous year) and approximately 1.2km or just under 17% (51% the previous year) by shield driving. The proportion of shotcreting methods against the total driven length for underground construction, urban and rapid transit rail tunnels (cut and cover and trenchless construction) amounted to over 50% (some 34% the previous year) at the end of 2000. Figure 1 provides survey results for the shares of various tunnelling methods.
The main line railway tunnels contained in Part B of Table 1 are largely related to the construction programme currently underway for Deutsche Bahn‘s new high-speed lines. The tunnelling activities being carried out in conjunction with the new Cologne-Rhine/Main railway line, dominate the figures. These tunnels are largely being built by mining methods. At the turn-of-the-year 2000/01, there was still only minor activity actually taking place in conjunction with the new railway lines being registered for the new Federal States.
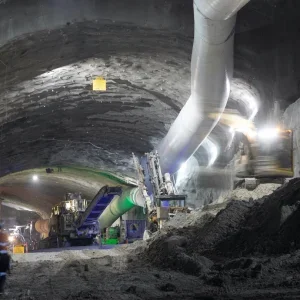
Road tunnelling (part S of Table 1) has gained in importance since the 1980s. This is clearly evident from the award curve in figure 2 and above all, from the curve pertaining to the award and length-related proportion of modes of transport in figure 3 (see over). Road tunnels are generally driven by mining methods, as is the case with main line tunnels; except where inner-urban tunnels are concerned, when shotcreting using roadheaders or drill and blast predominate.
An outstanding example of current road tunnelling is given by the Rennsteig Tunnel, under construction for the new A71 highway. When completed the Rennsteig will be Germany’s longest road tunnel with a length of 2 x 7.9 km (see p20).
If one compares the newly obtained driven lengths and excavated volumes for the turn-of-the-year traffic tunnel data with the statistics of recent years, then a revealing picture of how contracts are awarded is obtained. Figure 2 clearly reveals the significant influence of the new Deutsche Bahn lines.
After a steep increase in awards during the years 1982 to 1984, an equally steep down-turn was recorded for the next two to three years. The amount of awarded long-distance rail tunnels, as a proportion of the total awarded length in tunnelling over the years, fluctuates correspondingly. This is particularly evident in figure 3.
Planned Tunnelling Projects
The results of the survey relating to current planned tunnels and those due to be commissioned in the near future are of particular interest. Table 2 presents the award period as from 2001. The expected volume of new underground urban and rapid transit rail tunnels (nearly 75km) is quite considerable. By and large, these projects are all due to be commissioned within the next three to four years.
The high proportion of future long-distance railway tunnels (about 218km), as mentioned earlier, mainly relates to new railway lines; Cologne-Rhine/Main with approximately 23% of the line in tunnel and an overall route length of around 230km; Nuremberg-Ingolstadt with around 32% for roughly 80km and Nuremberg-Erfurt with approximately 40% over a part-route of around 105km.
The volume of road tunnels, about 89km, is also remarkable. More than two-thirds of the listed projects concern the old (western) Federal States. The measures being prepared in the new (eastern) Federal States are to a great extent still at the pre-planning stage and as a result, are not sufficiently secured to be included in the statistics. The planning here is being carried out mainly in conjunction with the “German Unity-Road Projects”. The 89km of road tunnels listed in Table 2 have all reached the planning approval stage. Furthermore, according to the current overview, additional road tunnels with a total length of almost 100km are planned. They have to be added to the figures contained in Table 2.
It is also of interest, as far as the planned tunnel projects are concerned, to ascertain in which regions they are constructed. Figure 4 contains these details, with distribution in accordance with the Federal States. For some of these projects, the environmental compatibility test (UVP) has already been concluded and determination of the route is currently underway. However, their realisation has not yet been absolutely secured, both in terms of time scales and financial backing.
Further planning data for projects in the new federal states is expected in 2002 and 2003.
Related Files
Figure 4
Figure 3
Figure 1
Figure 2