AstraZeneca’s R&D centre, being constructed in Cambridge, is an impressive new building. Transparent and clear, it’s vision is to be open to collaboration and open to the public. Underground it is striking too; the basement excavation is larger than the building in footprint, supported by 7.2m high cantilever walls with no propping, it required the removal of 120,000m3 of clay. The multi-level basement will house loading areas and many of the centres laboratories, some of which will be capable of operating without any direct supervision. Architectural input has provided some key challenges for the construction team including very large roof spans, and very tight specifications for architectural concrete features, which required an on-site batching plant for quality control.
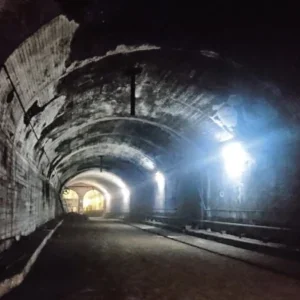
The service tunnel will run from the new R&D building, under the road, and to the energy centre; its main purpose will be to providing heating and cooling alongside all other ancillary energy services. The R&D building’s glass façade means the structure creates large volumes of heat in the summer months, a problem to which the energy centre has a novel and sustainable solution. The heat is extracted from the main building and drawn through the service tunnel with a cooling system to the energy centre where, through a dense water hydrothermal ground source heat pump system, the heat is transferred to the ground via 140, 250m deep boreholes. The system allows storage of heat in the summer, offering cooling, and extraction in the winter for heating, which makes for a very efficient system. The system is in fact so efficient that some of the R&Ds heat output has to be dumped to the environment via heat exchangers in the roof. The service tunnel itself is 128.6m in length, 4m internal diameter, with a total lining thickness of 550mm. The lining comprises of an SCL primary lining, with a membrane providing class II waterproofing specification, and a cast in-situ secondary lining. Tunnelling took place from a 10.5m diameter caision shaft at the energy centre side, mining downhill to maximum invert level below ground level was 12.4m at the R&D piled shaft. The tunnel will contain hot and cold-water pipes for the building, as well as for heat exchange. It will also carry fire suppression systems, gas mains, and power cables from generators, and the tunnel will contains a walkway, but this is for maintenance rather than a means of access between the buildings.
A number of construction methods were considered but discounted for site and client specific constraints. Methods considered included cut and cover, pipe jack, or a service bridge. Cut and cover might have been the simplest solution, however, the tunnel passes underneath Francis Cric Avenue, an important link into Cambridge and vital for access to Addenbrooke Hospital; closure of the road was therefore not an option. Pipe jacking was not considered feasible considering the gradient required to get underneath the road; and the option of a service bridge, discounting a tunnel entirely, was deemed to be too at risk of malicious interference. The chosen construction method was therefore an SCL/cut and cover hybrid; cut and cover between the energy centre and the caisson shaft, and SCL to the R&D centre. This allowed construction of the energy centre to continue whilst the rest of the tunnelling took place.
Structural Components and Construction Methods
Precast section
Construction of the cut and cover section took place before the erection of the frame for the energy centre. It consisted of 36 precast half rings, 5m in diameter, setting out the crown of the tunnel. Rings were set on a layer of blinding in the trench, concrete poured to shoulder level, and reinforced set on top. The reinforced slab was poured in one go, before the trench was back-filled. This allowed the team to excavate and spray the invert at a later date without impacting the construction programme at surface. During excavation of the trench groundwater was encountered at 3.5m BGL, much earlier than expected, and indicative of the problems the project was to face in its main excavation.
Caisson shaft
From the caisson shaft the majority of the tunnelling work was completed. The tunnel was offset from the centreline as this allowed more workable space within the shaft. Four pressure relief wells were bored to eliminate ground heave if any pressure pockets in the ground were come across. Alongside the precast concrete sections an FRC jacket was also cast behind segments and forced down as the shaft was sunk. Once the FRC had achieved strength the segments were taken away at the base of the shaft to allow soft eyes to be formed; the presence of the FRC removed the need for a steel frame to reinforce lintels and jambs. A bar reinforcement cage was bolted into the FRC jacket to form the portals, and sprayed ahead of tunnel commencing.
R&D shaft
The shaft at the R&D building, receiving the tunnel, was built using top down construction with secant pile walls. Piles were connected with a capping beam cast of waterproof concrete, over the areas of breakout in the shaft the piles were suspended from the capping beam. In order to maintain site access above ground for the construction of the R&D centre the shaft was not left open for the duration of the works. This meant construction of temporary works and the delivery of reinforcement and other materials had to be done in small packages and largely by hand.
SCL lining
As described previously, on the energy centre side of the caisson shaft it was only the invert that needed spraying because of the precast crown. The support already being in place meant that advances of up to 8m were achieved and this section of the tunnel was completed in just over a week. On breakout into the crown cavity there was a visible high-water mark where the void had filled with water and drained again between back filling of the cut and cover section and excavation from the caisson shaft. The remainder of the tunnel was excavated in three steps; top, top, invert. Crown excavation advances were one meter, invert advances two meters. Spiling was attempted in the excavation of the tunnel but was found not to offer a significant benefit. The run to the R&D shaft was downhill, meaning the water collected at the face and had to be pumped out.
Waterproof membrane
The waterproofing system was a welded membrane, consisting of a geomembrane with a nailed waterproof membrane connected to the concrete, sealed with additional patches and waterbars between secondary lining pours. Welded sections of membrane were pressure tested for quality control. A key challenge was linking the tunnel waterproofing to the R&D shaft waterproofing, where the cylinder had to be connected to the square opening, which required intricate details. Between waterbars the waterproofing system also included resin injection hoses to isolate leaks, and also inject behind the lining to seal them. In addition to measures to combat future water ingress, there was also active management of external groundwater pressure through perforated ducts which were cast into the primary lining invert. These were tied into the waterproofing membrane to isolate the groundwater and enable pump out, until it was cast in and grouted up.
Secondary lining
The secondary lining was cast in-situ onto the waterproof membrane. The shutter consisted of 196 pans bolted together by hand, and through the teams’ hard work they were able to achieve an average of one pour per week. The lining was set out to achieve a circular shape inside the less-than perfect primary lining by use of spud bars. These were threaded to enable fine tuning of the placing of the shutter. The point loads that they exerted on the lining however, did potentially contribute to some problems with the integrity of the waterproofing. The perfect circular shape of the finished interior of the lining was required for the modular pipe fixings which were to be installed on completion. When the secondary lining approached the R&D shaft the entire shutter was extended into the opening, and the lining wall and tunnel lining were cast at the same time. This required a significant piece of temporary works, but achieved an impressive result.
Geology and Groundwater
Geology
The area around Cambridge in which the project was situated is predominantly underlain by a crumbly white chalky clay called West Melbury Marley Chalk which doesn’t behave well in water, turning into a very gloopy slurry. The tunnel dipped through the Cambridge Green Sands and at the R&D shaft entered the Gault Clay which is a very good blue shiny clay.
Towards the end of the excavation the team encountered pockets of heavily saturated sand. Water was encountered much earlier than expected, and water pressures in the excavation exceeded what was anticipated. At several points, where there were leaks in the primary lining, significant water ingress was observed. Water flow at the face of the excavation was also prevalent; borehole data had suggested 0.4 l/s, however at times the team was pumping 4-8 l/s from the tunnel.
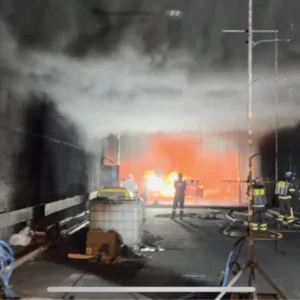
Water ingress – leaks and repairs There were areas where the waterproofing system had been compromised. The image on page 26 shows a leak through the secondary lining via a spud bar hole which has been plugged with grout. It was not possible to tell by observation whether this leak was as a result of the spud bar puncturing the membrane, or if a fault had occurred elsewhere and the water had travelled behind the lining to the grout plug, however drilling into it released a large amount of water. The solution was to inject a europhane based acrylic, which expands to somewhere in the order of 30 times its volume, into the hole to plug the leak.
Separately, the piled construction of the R&D shaft was also leaking as the waterproof membrane was being installed. Initially this didn’t present any problems, but as the tunnel drainage (perforated pipes and manholes as described previously) was back grouted the water table rose and leaks could be seen to ‘climb’ the walls over a 24 hour period, up to a cold joint between the secondary lining and the waling beam. The resolution was the same as with the shaft lining – injecting sealant into the leaks to plug them. At the top of the shaft the interface with the main frame contractor building the southern superstructure meant two different waterproofing systems needed connecting. The answer was to come up short with the shaft concrete, put in couplers, and to leave the waterproofing membrane exposed. This would allow the other waterproofing membrane to be welded on before being cast in. However, the action of resin injecting the leaks in the shaft meant that the water table continued to rise to the level of the exposed waterproofing, and started to ‘inflate’ it. The pressure on the underside of the membrane risked it failing catastrophically, so the decision was taken to cut a series of holes in the membrane to release the pressure. Over the run of the strip there was approximately 2 l/s coming out of the holes and, understandably, the contractor responsible for pouring concrete on top of it was not willing to do so.
Their suggestion was to drill a hole in the shaft wall to drain the water, and plug it after the concrete had been poured, but it was decided this was not an optimum solution given the shaft had only recently been repaired. Instead a series of trumpet flanges were welded onto the membrane to drain pocket and relieve the pressure. Once this was done the other contractor was prepared to install and bond their waterproofing membrane and concrete was poured. Water continued to be drained until the concrete was set, at which time the hoses were resin injected, cut back flush, and grouted up.
Settlement – data and analysis
The focus of the settlement analysis was for the protection of the road and services within it. The analysis initially used a Gaussian Distribution Curve method and then progressed to an Oasis FEM system to determine settlement profile and trough of the alignment, and set trigger levels. Designers specified the monitoring arrays to be used as the tunnelling progressed underneath the road. Taking one of the arrays as an example it is possible to illustrate the relation of the theoretical values to real world values. Plotting the initial inputs, assuming 1.5 per cent volume loss and a k value of 0.4 creates the blue line on the curve, almost equivalent to the yellow trigger level. As the tunnel progressed the actual ground level can be seen. The first thing to note is the slight drawdown, which is attributed to the amount of water being removed from the ground. As the tunnel passes under the array the ground level drops over the tunnel, a little more off-set than predicted by the excel model but the profile is similar to what is expected, with a significant amount of draw down. Total actual volume loss was 3.7 per cent and a measured maximum settlement of 39mm. The numbers are slightly misleading because of the amount of drawdown, the convergence monitoring was confirming that the movement in the tunnel wasn’t as significant. As the settlement prediction calculation is only designed to take inputs 2.5 times the diameter from the point of inflection, the data could be clipped and the effects of the drawdown removed.
The result of this data analysis gave values, and a plot, much more akin to the prediction. Volume loss was now 1.5 per cent, maximum settlement reduced to 28.5mm, understandable, given that the original calculations didn’t take account of the effects of the groundwater.