CLEAR PRESENTATION WHEN DEMONSTRATING A fact in construction dispute proceedings is essential. It can dictate the outcome of a dispute and applies equally to claim submissions and any independent testimony required in court, arbitration or other formal proceedings. Because of the complexities arising in delay analysis and its terminology, it is often characterised as a ‘dark art’. A simple presentation of a sound methodology arriving at clear and persuasive conclusions, goes a long way to demystify this so called dark art.
The nature of the construction project and the details of the dispute usually dictate the most appropriate delay analysis method to be applied.
Here, two fundamental scheduling methods are examined for their application to projects of a ‘linear’ nature (such as roads, bridges, tunnels, etc.):
¦ The Critical Path Method (CPM)
¦ The Linear Scheduling Method (LSM).
CPM is a scheduling method that is more widely used for construction programme development and management.
However, for linear projects, the lesser known LSM is a more informative approach. This methodology uses graphical representation in a two-dimensional (2D) diagram within time and location axes.
In this article, the potential and benefits of LSM graphs for the purposes of forensic delay analysis of linear construction projects are reviewed. A hypothetical tunnelling project case study is used to demonstrate how as-built information can be incorporated into the LSM graphic to demonstrate the various project parameters, the actual progress of works, and the cause and effect of delay events.
WHAT IS A LINEAR PROJECT?
‘Linear project’ is the term that characterises a construction project with longitudinal, spatial and repetitive construction activities. Examples include highways, pipelines, bridges, railway-track systems and tunnelling.
The main characteristics of linear projects are:
¦ Repetitive identical activities along the length of the project (for tunnels, pipelines, etc.).
¦ Repetitive activities carried out irrespective of location and without a dependency on any particular spatial sequence. For example, if one section of a tunnel is temporarily inaccessible, work might still progress along other sections.
¦ The timely completion of linear projects is highly dependent upon efficient productivity rates and optimum resource utilisation for repetitive activities.
CRITICAL PATH VERSUS LINEAR SCHEDULING
The CPM and the LSM are both scheduling and programming methods used for developing, managing and monitoring the time aspect of construction projects.
CRITICAL PATH METHOD
The Delay and Disruption Protocol published by the Society for Construction Law1 describes the CPM programming method as:
‘The methodology or management technique that, through the use of calculation rules (usually automatically carried out by programming software), determines the critical path and calculates float.’
CPM is the most commonly known and used scheduling method in construction management. Schedules are prepared by inputting data for individual activities (i.e. durations, dates, logic relationships, dependencies, etc.) into proprietary programme software tools. The software subsequently applies algorithms to calculate free float, total float, critical and near critical paths for the combined elements of the project.
CPM is a valuable tool that can display graphical visualisations, normally in the form of a Gantt Chart.
However, because CPM focuses primarily on the time aspect of construction projects, the outcome is a one-dimensional (1D) overview. Caution should be applied when using this scheduling methodology because several important elements are not factored into the process2.
For example:
¦ Spatial analysis and the constraints/ parameters of the physical layout of the site are not automatically considered. CPM algorithms work on activity and relationship inputs and rely on the planner to avoid conflicting spatial requirements on the site.
¦ Optimum productivity rates for construction elements activities are not visually demonstrated in typical CPM graphs.
¦ Resources requirements, availability, cost, productivity levels and continuity of work are not visually demonstrated in typical CPM Gantt Charts.
An example of a typical CPM graph (Gantt Chart) is presented in figure 1.
LINEAR SCHEDULING METHOD
LSM is a graphical method, the output of which is a two-dimensional (2D) diagram that depicts both time and space in one chart.
Unlike CPM which is activity-focused, LSM is production-focused. Individual activities are represented by single lines on a chart, whose gradient is proportional to the rate of productivity. Thus, the graphical output shows the combined relationship between duration and output at a particular time and in a particular location.
The use of the linear scheduling method can enable:
¦ Avoidance of impact from space restrictions on site.
¦ Optimum productivity of all activities, ensuring that one activity does not adversely impact upon production rates of another.
¦ Continuity / uninterrupted working of resources.
The LSM methodology is particularly suitable for application to projects with a longitudinal or spatial dimension, or where repetitive activities occur, and optimum productivity rates are essential to achieve timely completion (e.g., tunnelling projects)3.
LSM graphs display two axes: one for time and the other for location, with data symbols depicting:
¦ Activity lines with different styles to identify different activities or resource crews (for example, the excavation activity of a road project). The gradient of each activity line depicts the productivity rate of that activity.
¦ Bars depicting an activity or constraint at a specific location for a specific period of time (for example, construction of culverts at specific locations of a road project).
¦ Blocks depicting an activity or constraint at a wide area of the site arising for a specific period of time (for example, areas of restricted access).
An example of a typical LSM graph is presented in figure 2.
Additional information can be added to LSM graphics to enhance the overall picture. This may include the site’s profile section drawing or the type of soil at various locations and other relevant information.
A comparison between CPM and LSM graphs is depicted in figures 1 and 2 and shows the construction works of a theoretical pipe-laying linear project, including the construction of a culvert and a site-access restriction.
The CPM graphical visualisation is in the form of a Gantt Chart. Time is depicted along the horizontal axis with the activities depicted in the form of bars.
By comparison, the LSM graphical visualisation uses a two-dimensional graph showing time on the vertical axis, and location on the horizontal axis, (i.e. a steeper line reflects a slower activity)4.
Methodologies for unitary projects or work elements (floors, houses, apartments, stores or offices), include:
¦ Line of Balance (LOB) (O’Brien 1969; Carr and Meyer 1974; Halpin and Woodhead 1976; Harris and Evans 1977).
¦ Construction Planning Technique (CPT) (Peer 1974; Selinger 1980).
For longitudinal projects (highways, pipelines, tunnels, etc.), published methodologies include:
¦ Time Versus Distance Diagrams (Gorman 1972).
¦ Linear Balance Charts (Barrie and Paulson 1978).
¦ Velocity Diagrams (Dressler 1980).
¦ Linear Scheduling Method (LSM) (Johnston 1981; Chrzanowski and Johnston 1986; Russell and Casselton 1988).4
APPLICATION OF LSM IN FORENSIC DELAY ANALYSIS
Construction dispute resolution processes often require a retrospective delay analysis to demonstrate the effect of delaying events5. The importance of a clear and easily understandable delay analysis presentation, within a construction claim or other dispute resolution proceedings, cannot be overstated.
Retrospective delay analysis methodologies that are based on factual data and linked to contemporaneous as-built project records (for example the ‘as-planned versus as-built’ methodology)6, provide realistic results when compared to theoretical prospective delay analysis methodologies (for example the ‘impacted as planned’ methodology)7.
CPM scheduling methods are frequently used in forensic delay analysis. This method has several limitations, particularly when analysing linear projects8. CPM graphs do not visually demonstrate changes in productivity rates, for example, caused by potential disruption. Furthermore, CPM graphs do not visually identify the location of activities and/or restrictions that occurred during the project.
LSM scheduling methods used for forensic delay analysis of linear projects can display valuable insight of the actual progress of the works in relation to location. LSM can graphically depict changes in production rates, the interrelationship between resources, locations and durations.
Its visual representations are easy to understand and read, even for those with little to no experience in construction programme management or the project specific details. They are also useful for those who become involved in the project during the latter stages, or where dispute resolution processes introduce new individuals, such as mediators, adjudicators, arbitrators and judges.
Contemporaneous as-built information can clearly and concisely display project history or specific activities / events in relation to the physical conditions in a single graph.
The delay analyst, by reviewing and analysing the LSM graphs, can make considerable observations of the actual progress of the works and structure the delay analysis around the LSM graphs.
Below is a hypothetical tunnelling project case study providing an example demonstrating how the asbuilt information can be incorporated into LSM graphical tools and what observations / conclusions can be produced by reviewing the LSM graphs for the purposes of forensic delay analysis of linear projects.
CASE STUDY: FORENSIC DELAY ANALYSIS OF A TUNNEL CONSTRUCTION PROJECT
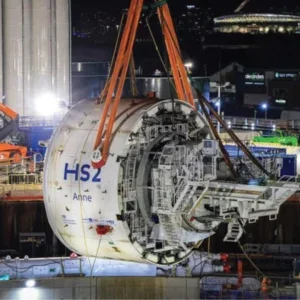
The following hypothetical case study assumes a 4km tunnel that has been built using one tunnel boring machine (TBM).
With its large rotating cutterhead, a TBM can build tunnels through soil, rock, or a mixture of both. This multifunctional construction tool can excavate and at the same time install the permanent reinforced concrete lining of the tunnel as it progresses. The main characteristic of the TBM is that while boring, it installs precast concrete lining segments and uses hydraulic rams to push itself forward.
The timely completion of the tunnel is usually reliant upon the efficient and uninterrupted operation of the TBM. Two main parameters that affect the TBM operation and productivity are:
¦ The actual soil conditions; and
¦ The timely production and availability of the precast concrete tunnel wall segments against which the TBM can push against and continue drilling.
The process of plotting data for the planned and actual progress of the TBM operation into the LSM graph highlights the periods and locations of:
(a) Slower than planned progress.
(b) Any work stoppages.
(c) Any changes to the planned sequence.
These observations can then form the basis of further forensic examination in order to identify the cause and effect of these delay events.
Figure 4 depicts a theoretical LSM example where:
¦ The dotted black activity line represents the planned progress of the TBM.
¦ The straight black activity line represents the actual progress of the TBM.
¦ The gradients of the respective activity lines depict the planned and actual productivity rates. The steeper the gradient indicates less work completed in the period, thus a lower rate of productivity.
¦ The arrows represent the direction of travel of the TBM and the actual productivity (gradient). Red arrows highlight periods of lower productivity rate than planned.
¦ Some significant locations are shown in yellow circles, for annotation purposes (i.e. location A, B, C, etc.).
¦ The observations arising from the LSM graph are listed in the grey boxes to the right of the graph and are numbered with Roman numerals (I, II, III, etc.)
This simple LSM graph with explanatory notes efficiently depicts a comparison of planned vs actual progress of the works and highlights specific delay events.
Further forensic investigations into each delay event enables enhancement of the LSM graph to include additional as-built information that informs detailed conclusions as to specific causes of the delays.
In addition, enchased LSM graphs can provide an easy-to- understand snapshot that convey the periods and causes of low productivity assisting in a more detailed disruption analysis. The disruption analysis helps to demonstrate whether works were disrupted by contract delay events or, whether the contractor was not able to perform efficiently.
Figure 5 depicts an enhanced LSM graph where the following enhancements have been added:
a. The actual restricted areas and periods (grey bars / blocks).
b. The actual period required for the assembly of the TBM (blue bar).
c. The period required for the replacement of a TBM’s defected part (red bar).
d. The actual soil conditions under the horizontal axis (location chainage).
e. The percentage of the fabricated precast concrete segments of the tunnel wall to the left of the vertical axis (time).
LIMITATIONS OF THE LSM IN FORENSIC DELAY ANALYSIS
LSM graphs used for forensic delay analysis have limitations.
As with all retrospective delay analysis methods, a typical problem that is often encountered is the availability, format, and accuracy of the contemporaneous data records. Creation of LSM graphics requires the delay analyst to import a vast amount of as-built data into the proprietary software application.
A lack of contemporaneous or inappropriately formatted records can be problematic, resulting in a time consuming and resource-intensive analysis.
LSM for the purposes of forensic delay analysis is a graphical method that does not rely upon an underlying mathematical model. Various published scientific papers have attempted to define a mathematic model for LSM analyses9, but these have not been widely adopted in proprietary software packages. Consequently, the conclusions deriving from LSM graphs, especially regarding the critical/driving activities, are based on the delay analyst’s observations, construction knowledge experience and common sense, rather than automated software calculations.
CONCLUSION
When applied to linear projects (such as tunnel construction), LSM can provide a more thorough and informative analysis of the cause and effect of delay events when compared to the CPM method.
As with any delay analysis, the output of LSM is dependent on the quality and accuracy of the raw data available at the input stage and the experience and technical ability of the analysts.
The LSM two-dimensional (2D) graphical representations (‘time-chainage graphs’) enable a snapshot view and valuable insight comparing, at a glance, planned vs actual performance and productivity, in time and space.
Further forensic analysis can then focus on key events or periods.
LSM graphs are practical, relatively easy to understand, and convey a wide range of information in a format that is easy to assimilate. These are important attributes to consider when supporting claims or opinions before a wider audience in formal dispute resolution proceedings.