Estimating groundwater inflow is a difficult art, even if done carefully. The difficulties arise from several sources. The geology of the site may not be adequately understood. The inflow equations may not adequately represent the conditions. The collected data may have limitations that are not accounted for. The field investigation may not have found the areas providing most of the flow. This article focuses on the last two issues in relation to the Chattahoochee Tunnel.
Project Description
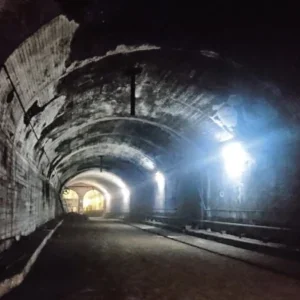
The Chattahoochee Tunnel is a deep sewer tunnel located in Cobb County (metro Atlanta), Georgia. It is 15,125m long, has an excavated diameter of 5.5 m and ranges in depth from 28 to 108m below the ground surface. It is designed to transmit wastewater from shallow sanitary sewers to a large, regional treatment plant. It is not intended to receive combined sewer flows or to become overpressured relative to the surrounding groundwater. A tunnel was selected to reduce social and environmental impacts of construction and because the bedrock in the area is considered excellent for tunneling. The tunnel is owned by the Cobb County Water System. The tunnel designer, Jordan, Jones & Goulding, headquartered in Atlanta, performed the geotechnical work on which this article is based. Currently under construction by Gilbert/Healy, LP, the tunnel is scheduled for completion in 2004.
The ground in the project area consists of medium-grade metamorphic rock overlain by progressively weathered rock and residual soil. The ground profile is divided into three zones: the bedrock zone, overlain by the transition zone, overlain by the soil zone. The bedrock zone is characterized by non-porous fresh bedrock with some open fractures. The transition zone consists of moderately weathered rock with abundant open fractures. The soil zone is a strong, silty to sandy residual soil produced from the in-place weathering of the rock. This soil has significant intergranular porosity, but the fractures tend to be collapsed. The soil zone is typically 10 to 25m thick and the transition zone, 3 to 25m thick. The tunnel is designed to be within edrock as practical.
The water table is typically in the middle of the soil zone, at depths of 1-15m. The soil zone is the primary storage reservoir for groundwater. The transition zone also contains significant storage and, with its abundant open fractures, is the principal transmissive interval. The bedrock zone contains little storage and transmits some water through its fractures. Numerous small streams and infiltrating rainfall, which is substantial in the Atlanta area, provide groundwater recharge to the soil zone along the tunnel alignment. Downward leakage through the soil zone over broad areas provides recharge to the transition zone. Bedrock fractures that intersect the transition zone will allow flow downward into the tunnel. As the transition zone is much more transmissive than the bedrock zone, it will serve to equalise heads across the area around the tunnel so that there is always sufficient water available to sustain downward leakage through bedrock zone fractures. Groundwater inflow into the tunnel will be regulated mainly by bedrock fracture system permeability rather than the availability of water in the transition zone.
Investigation Methods
The geotechnical investigation for the Chattahoochee Tunnel included 50 cored holes drilled along the alignment at intervals typically ranging from 150 to 600m apart. The spacing and locations of the holes were based on anticipated geologic conditions, the desire to get fairly uniform coverage of the alignment, and, most significantly, the ability to find drilling sites in a fully developed urban setting. Bedrock permeability was tested using 300 packer tests in the coreholes. Each packer test covered a 6m interval; the tests ranged in depth from about 8m below the tunnel invert to between 20 and 55m above the tunnel crown.
Packer tests work by isolating a section of borehole between two rubber packers. Water is then injected into the isolated section of rock under pressure. The flow rate is directly proportional to the applied head (pressure). Permeability is basically the coefficient of proportionality. (There are also some factors related to the shape of the system.) Permeability is held to represent the degree to which the rock fractures will permit the flow of water. This coefficient of permeability is also known by other names with slightly different definitions, including hydraulic conductivity, transmissivity and lugeons.
The packer tests for the Chattahoochee Tunnel were run for about ten minutes each, with widely varying results. In a few cases, the rock would take more than 100 litre/min, resulting in permeabilities of around 10-3 cm/s. In many more cases, the rock would take less than 0.5 litre/min. Such low rates were difficult to measure with our equipment, without significantly extending the test time. This 0.5 liters per minute floor marks the lower quantitation limit (LQL) of the test method for our project. This LQL corresponds to a permeability of about 10-6 cm/s. Fortunately, this permeability is very low, resulting in no more than very slight dampness along rock fractures.
Permeability and Inflow
Calculating inflow into a tunnel is basically a back calculation of the packer test results. This time, permeability and head are known, and the flow is derived. The total inflow to a tunnel will equal the sum of all the inflows. If the head is held constant, then the total inflow should equal the total permeability, times various factors related to the shape of the system. These summed relationships point toward average rates of inflow and permeability per unit length of tunnel. The average inflow per metre should be proportional to the average permeability per metre.
However, the range of permeability in fractured rock is extreme, typically ranging over six orders of magnitude, or one million fold. This means that the inflow at one place in a tunnel may be one million times greater than the inflow at another place – a commonly observed phenomenon in hard rock tunnels, where large inflows lie adjacent to dry walls. The packer-test results from the Chattahoochee Tunnel show a similarly large range of more than three orders of magnitude, considering that the lower end of the permeability range is below the LQL, and therefore not quantified.
If a fairly large number of packer tests were performed, one could reasonably assume that they would be statistically representative of conditions along the tunnel alignment. One could take the average of the packer-test results and use it to represent the average permeability per metre. When summing the permeability values to take the average, however, one would quickly find that only the few highest tests really mattered. The rest of the test results would be lost in the small decimal places. But, if only a few of the highest tests matter, what would happen to the inflow estimate if one of those tests had not been performed? What if the highest permeability were under a building or a river, where it could not have been tested? It is practically impossible to find the very highest permeability until the tunnel is bored. But if it is found, how does one know it is really the highest?
The essence of the problem is that the average of the packer test results will always underestimate the upper end of the permeability range, and therefore underestimate the inflow. This underestimation becomes more severe with fewer tests. The problem is only made worse if pumping tests are used instead of packer tests to measure permeability. The very high cost of pumping tests generally limits their use to only a very few locations.
Taking an average of the test results always underestimates inflow because the average permeability does not really exist. Field geologists have long known that the widths and lengths of fractures vary exponentially and are log-normally distributed. Likewise, it follows that fracture-controlled permeability is also log-normally distributed. But a log-normal property has a geometric mean, not an average. As more and more samples are collected from a log-normal population, there will be an equal chance of getting a low result as there will of getting a high result. But if only the high-end results matter when the average is summed, the average will get ever larger as the number of samples is increased.
The problem is now a paradox. Because inflow accumulates along a tunnel, one would want to know the average permeability per metre of tunnel in order to estimate the average inflow per metre. But the average does not exist. Furthermore, inflow estimates based on the distribution of test results are unstable because the high end of the permeability range controls all of the flow, and the high end will never be discovered until the tunnel is mined. The solution lies in using the packer test results to establish a simple, statistical model of permeability per metre, or inflow per metre.
Log-Normal Model
The accompanying graph shows a log-normal curve fitted to a cumulative plot of packer test results. This curve is a mathematical model. It allows the high end of the permeability range, which provides all the flow, to be extrapolated and stabilised from the bulk of test results in the curve middle range. The horizontal axis represents the probability that any new test would have a lower value. The vertical axis represents permeability. Because the vertical axis has a logarithmic scale, the log-normal curve is symmetrical about the midpoint of the horizontal axis.
The graph shows the LQL, as well as an upper quantitation limit (UQL). The UQL is upper limit of quantifiable packer test results for the Chattahoochee Tunnel. This upper limit marks the point at which the rock fractures took more water than could be accurately delivered under consistent pressures. The UQL is an artifact of the test equipment, including the gauges and pipe diameter. The log-normal curve extends past the LQL and the UQL because they have nothing to do with the rock and everything to do with the equipment.
This same graph can be used to calculate inflow if the horizontal and vertical axes are reinterpreted. Because inflow is proportional to permeability and head, the vertical axis can be recalculated to be an inflow axis if the head is held constant at an average value. The vertical axis is now in terms of inflow per unit length of tunnel. The horizontal axis can be reinterpreted as the percentage of tunnel length, and then multiplied by the length of the tunnel to be a length axis. The inflow is now the area under the curve, but curves are hard to use. The curve can be simplified to a line if the horizontal axis is transformed to a normal distribution, or Z, axis by the normal distribution function. The effect of this transformation is to stretch the ends of the axis until the curve becomes straight. Inflow is now the area under the line.
The second graph shows a log-normal plot of the same data. The data are randomly scattered around a median correlation line, and between upper and lower bounds. This scatter is interpreted as random variability caused by having a limited number of test samples. As the number of tests increases, these bounds tend to move closer together. As the number of tests decreases, they tend to move farther apart. The actual log-normal model should lie somewhere between the two bounds. Inflow can be calculated using any of the three lines. The upper line will give an upper-bound inflow estimate; the lower line, a lower-bound estimate. For the Chattahoochee Tunnel, the upper-bound estimate based on this method is 8,740 litre/min and the lower-bound estimate is 4,180 litre/min.
Conclusions
The permeability distribution is an important part of estimating inflow into tunnels. Methods that rely on taking the average of test results will tend to underestimate inflow, even if all other components of the analysis are correct. Log-normal plots can be used to stabilise the high-end of the permeability distribution.
The log-normal correlation line represents the simplest theoretical distribution of permeability in fractured bedrock. Deviations from the log-normal line can be caused by three factors. The first is random scatter caused by having a limited number of test samples. Random scatter is accounted for by using the upper, middle and lower correlation lines. The second factor is limitations in the test method, such as the LQL and UQL. The LQL and UQL are accounted for by extending the correlation lines past these limits. The third factor is geological changes or limitations on permeability, such as fault zones, different rock types or changes in fracture fillings. Such geological factors tend to cause a change in the slope of the correlation line indicating bimodal permeability. Unlike random scatter or test limitations, these geological changes are real and must be accounted for.
This method can be used with as few as 20 tests, as long as there are no complications. More tests will be needed if unique correlation lines are difficult to draw or if the upper and lower correlation lines are too far apart. More tests will be needed if there are more than a few tests below the LQL or above the UQL, and also if there is a possibility of complicated geology or bimodal permeability. In general, it is better to perform as many packer tests as practical and to keep them as simple as possible.
Related Files
Histogram of 298 packertest results from the Chattahoochie Tunnel
Conceptual geologic profile
Log-normal distribution of permeability


