The TBM drives for the headrace tunnel of the 690MW Kárahnjúkar hydropower scheme, in Iceland, found highly varied geological conditions, particularly with the large water inflows that were suffered in some parts of the bores. Beyond that tough construction experience, however, different lessons are being learned that should be useful for tunnel lining works in a wider range of water projects thanks to client-sponsored research into surface, and hydraulic, roughness.
The client, national power company Landsvirkjun, was naturally focused on headloss in the hydraulic system not only for fundamental economic reasons but also due to the potential scale of lost energy, given that the 7.2m-7.6m diameter headrace tunnel is 39.6km long. Prior to the research, design estimates used in planning the project estimated the hydraulic friction losses at anywhere between approximately 60m-95m, which is about 10%-17% of the nominal gross head.
Beyond the immediate client, other project sponsors with water tunnels in which headloss is of key importance can also draw upon the research to help secure additional economic and operational benefits. They will require the supply side services of designers and contractors to absorb the research findings to help estimate, monitor and adjust the surface roughness of tunnel lining works during the construction phase.
Research project
The Kárahnjúkar hydropower project marked the first use of TBM tunnelling in Iceland.
Design and construction of the scheme has been a significant international effort, drawing upon services from local and foreign consultants in the client’s design engineer Kárahnjúkar Engineering JV (KEJV) – VST Consulting Engineers, Pöyry, MWH, Rafteikning and Almenna Consulting Engineers. The design programme commenced in 2000. As local practice prevents the designer from supervisory duties, a consortium was hired as owner’s representative – VIJV, which comprises Mott MacDonald, Linuhonnun, Hnit, Fjarhitun, Sweco, Norconsult and Coyne et Bellier.
The main contractor undertaking the KAR-14 headrace and Jokulsa diversion tunnel works under a re-measurement contract, and other works, is Impregilo. The headrace and diversion tunnel have been excavated through varied volcanic and sedimentary rocks mostly by TBM with some drill and blast, though slightly more than initially planned. Three TBMs – two 7.2m diameter main beam shields and a 7.6m diameter machine – were supplied by Robbins for the project (T&TI, January 2007, p4). Excavation of the headrace commenced in mid-2004 and finished late 2006, and the Jokulsa branch is almost completed.
The view was that the available technical data on roughness of long water tunnels was incomplete and of limited reliability. In particular, there was a lack of information on unlined TBM-driven tunnels due to limited data from the construction phase. The idea for the tunnel roughness measurement programme came from lead headrace tunnel design engineer, Joe Kaelin, of Pöyry Energy. He also supervised the studies, undertaken by others in KEJV – local firm VST in conjunction with Pöyry – and completed during the headrace excavation. The research effort was supported by VIJV and Impregilo.
A different, established approach – Rønn’s “IBA” method, from Norway – was used to assess headloss in unlined tunnels excavated by drill and blast. The method is one of many approaches and is based on measurements of cross section and longitudinal geometry over 20m-25m long portions of tunnel to calculate wall roughness and equivalent hydraulic friction.
To prepare for the studies on the TBM drives, the team drew upon methodology of wall roughness and hydraulic headloss studies established by Pegram and Pennington, in the report to the Water Research Commission by the University of Natal. It included the case study of Delivery Tunnel South of the Lesotho Highlands Water Project (LHWP), but looked at different surface types (sandstone, granite, shotcrete and concrete) in TBM-driven tunnels in general. Laser measurement was used in four tunnels, two in LHWP.
Measurements – visual inspection
At Kárahnjúkar, the aim was to collect physical measurement data during construction along the entire length of the headrace. Limited time and budget, however, kept the visual inspections to 50m intervals over 2005-6.
A 1m wide strip of rock was inspected below springline, at springline level and in the crown at the side of the tunnel, opposite the mucking out conveyor, to categorise intact rock or shotcrete into different roughness classes – smooth, medium and rough. The classes were defined to represent the range of observations and were based on measurements of the maximum average deviation of the wall surface from a straight bar ruler – 40cm long for rock surfaces, 80cm long for shotcreted surfaces; they are, in principle, independent of geology.
It should be noted, though, the observations took into account planned finishing work subsequent to inspections.
Observed large-scale rock features, such as joints and/or pockets, were classified into four categories by the depth and number. In total, almost 90% of the TBM drives were inspected visually.
In summary, a quarter of the inspected tunnel was shotcrete lined, and those sections classed as: smooth (14%); medium (64%); and, rough (22%). While rebound shotcrete prevented some 4% of the unlined rock surfaces from being classified, those assessed were classed as: smooth (26%); medium (65%); and, rough (9%).
In terms of the geological strata, those rocks with proportionally more rough surfaces ranged from pillow lava, tillite, and cube jointed basalt in decreasing order to andesite, scoria, pillow breccia, scoracious basalt, conglomerate, olivine basalt, porphyric basalt, tholeiitic basalt, and sandstone/conglomerate, and sandstone. Finally, at the other end of the range, siltstone and sandstone/tuff were classed as having with no rough surfaces.
Observations of the range of joints and large scale irregularities concluded that about 45% were sparse and/or shallow, a quarter were dense and/or deep, a quarter were free of joints, and approximately 5% of the surfaces contain large rock break-out.
Rock with many and/or deep joints were found, in decreasing order of importance, associated with: cube jointed basalt, pillow lava, tholeitic basalt, olivine basalt, tillite, andesite, porphyric basalt, scoria, pillow breccia, scoracious basalt, sandstone/tuff, conglomerate, sandstone/conglomerate, sandstone and siltstone. Joint-free surfaces were found in association with: siltstone, sandstone/conglomerate, sandstone, conglomerate, sandstone/tuff, scoracious basalt, scoria, tillite, porphyric basalt, cube jointed basalt, olivine basalt, tholeitic basalt, pillow lava and andesite.
Measurements – laser scan
Laser scans were executed at approximately 10% of the visually inspected surfaces. Rock surfaces were measured – using a FARO Scan Arm portable coordinate measuring machine – below springline level, and shotcreted surfaces above springline level as the upper parts were lined when measurements were taken.
About 600 profiles were scanned at 73 different locations over nine months. The sites to be scanned were chosen from photographs to represent the different roughness classes, and were dry, or had to be dried, before the scan. The support platform for the scanner was bolted to the wall and the head of the scanner fixed to a 1m long bar. Steady motion scanning was facilitated by a manually-operated cogwheel.
Scans were made of the walls in 40mm–60mm wide strips, each strip comprising 640 points. The coordinates are scanned with an accuracy of 0.1mm and point spacing of less than 0.25mm. At each survey site, the scanner measured two 40mm wide by 1m long strips, separated vertically by about 100mm. Four profiles with a vertical separation of 8mm were extracted from each scanned strip, which provided eight roughness profiles scan sites. The average sample spacing was 0.1mm.
Data analysis
The data obtained from the visual and laser scan measurements were processed according to the method developed by Pegram and Pennington, which transformed the data from physical to hydraulic roughness. These drew upon three parameters: equivalent sand grain roughness; a friction factor; and, a flow resistance coefficient.
Wall roughness in TBM-bored tunnels has a wave-like structure that varies with geological strata as well as the operation of the cutterhead, though data on TBM advance rates were not explicitly compared to intact roughness. The researchers note further that the scale of the roughness arising from cutting speed or method is usually an order of magnitude smaller than that due to geology. The wave properties can be calculated from laser measurements.
In the initial design estimates, the equivalent sand grain roughness for unlined TBM drives was taken as 10mm, and 20mm for shotcrete walls. The data indicated that 40% of the headrace had a larger roughness value and 60% lower. The average value for the shotcrete walls was determined to be lower than estimated, at 17mm.
Based on the calculated roughness data, and taking the 7.6m diameter TBM to have bored 14.7km and the two 7.2m diameter machines to have excavated a total of 20.8km, the specific headloss in per unit length of the tunnel was determined. The researchers note that the calculations showed specific headlosses for shotcrete sections to be similar to those for rock with large break-out, partly due to the minor throttling effect of its thickness slightly reducing the internal diameter of the tunnel.
Based on the measurements and data analyses, the research determined that the overall headloss from friction in the TBM-bored section of the headrace was 64m with a tolerance of 10%, which puts it at the lower end of the initial design estimate.
Verification work is now underway to derive the headloss in the headrace during operation of the power plant, which started-up last year. While the headrace is not yet carrying the full, design flow rate, so far the direct measurements show that operational headloss is 6% less than that predicted from the roughness measurements.
R&D and applicability
The researchers say the key area for further research is to improve the accuracy of matching the scanned data of wall roughness to the equivalent sand grain roughness, independent of tunnel diameter.
Their hope is to gain backing to undertake laboratory tests to refine the knowledge of how equivalent sand grain roughness relates to actual wall surfaces. Such research will benefit all water conveyance tunnels.
The findings can also assist in managing changes to lining works that might be required or arguably be of longer-term benefit to a client. There is always the possibility of following up the construction phase to ensure the contracted performance has been delivered.
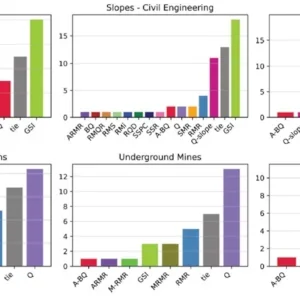
Equivalent sand grain roughness calculated against rock type Equivalent sand grain roughness calculated against rock type Specific head loss ranges in different diameter section of headrace Specific head loss ranges in different diameter section of headrace The laser scanned vertically-separated strips of wall surface The laser scanned vertically-separated strips of wall surface – 1 The laser scanned vertically-separated strips of wall surface The laser scanned vertically-separated strips of wall surface – 2 Tunnel wall roughness research in the dominant, TBM-bored parts of Kárahnjúkar headrace was done by establishing surface categories through visual inspections, and some laser scan Tunnel wall roughness research – 1 Tunnel wall roughness research in the dominant, TBM-bored parts of Kárahnjúkar headrace was done by establishing surface categories through visual inspections, and some laser scan Tunnel wall roughness research – 2 Following the visual inspection to pre-categorise the rocks into roughness classes, about 10% of inspection sites were scanned by wall-mounted laser Following the visual inspection – 1 Following the visual inspection to pre-categorise the rocks into roughness classes, about 10% of inspection sites were scanned by wall-mounted laser Following the visual inspection – 2 Figure 1. Rock class – smooth Fig 1 Figure 2. Rock class – smooth Fig 2 Figure 3. Rock class – medium Fig 3 Figure 4. Rock class – medium Fig 4 Figure 5. Rock class – rough Fig 5 Figure 6. Rock class – rough Fig 6 Acknowledgements
T&TI thanks the research team for the briefing, especially Katrin Martha Hakonardottir of VST, Gunnar Gudni Tomasson of Reykjavik University and VST, and their co-authors in a recent research paper on the work, Bela Petry of Delft Netherlands and Bjorn Stefansson of Landsvirkjun. They also acknowledge the initiative for and supervision of the research by Joe Kaelin of Pöyry, the visual inspections by Snorri Gislason, a geologist at VST, and the laser scan work by René Fretz, a survey engineer with Pöyry.