Load growth in the Yukon is forecasted due to increases in residential/general service, expanded industrial loads, and potential new mine loads. Power for almost three-quarters of the Territory’s 116MW generating system originates from hydroelectric sources. The Mayo B project, completed in 2011, increased capacity at this site from approximately 5MW to 15MW. The project displaces diesel generation and results in a reduction in annual greenhouse gas emissions of approximately 25,000 tonnes per year.
REGIONAL GEOLOGY
Overburden sediments in the Mayo B project area are dominated by glacial materials in a complex assemblage of moraine tills, with overlying and often intercalated glaciofiuvial and glaciolacustrine deposits. Sand and gravel glaciofiuvial plains and terraces occur as generally fiat-lying outwash areas situated between topographically high bedrock outcrops, and or moraine covered (till) ridges. In some cases, these glacial sediments also form extensive buried bedrock valley fills.
Bedrock in the area is comprised of tightly folded, strongly foliated rocks of the upper Proterozoic to lower Cambrian Hyland Group (Yukon Geological Survey). Predominant rock types are typical of low-grade metamorphic conditions, and include thinly- to thickly-bedded (10mm to 200mm) shales, quartz-meta sandstones, quartz pebble conglomerates, quartz-mica schist, phyllite to sericite/muscovite schists, and weak chloritic schists. The bedding contacts within the rock were often "greasy" to the touch, a result of the mineralogical presence of kaolinite (up to six per cent by weight) within the bedrock. The design friction angle along schistosity or bedding within the phyllite is relatively low, at approximately 17o. Among other constraining site conditions, these rock types and bedrock conditions, particularly where differentially weathered, were contributing factors in defining the final layout of the Mayo B project.
PROJECT CONVEYANCE OPTIONS
Originally, three alternative tunnel alignments were evaluated, with different combinations of open tunnel/canal/penstock conveyance to the Mayo B powerhouse (Figures 2 and 3).
The first alternative required construction of a 2km-long tunnel, discharging into an open canal via a vertical shaft raise. The potential for significant cost increases that could result with the presence of a deep buried soil valley in fill between bedrock outcrop areas (Figure 3) was a limiting factor in evaluating this alternative. It was also determined that construction risk existed due to the presence of permafrost, and steep slopes with difficult access conditions. Tunnelling through overburden within the deep buried valley in gill would prove risky due to high content of boulders and cobbles. It was deemed to be a nonviable option.
A second alternative specified a full-length tunnel to be driven through bedrock, with a possibility of encountering a major fault zone at the tie-in to the existing Mayo A tunnel. The plan was to break through a possible fault zone, and connect to the Mayo A tunnel near its downstream end, at approximately 30m depth below ground surface. The experience gained from construction of Mayo A tunnel in the 1950s indicated difficult tunnelling through the fault zone, forcing a tunnel diversion and installation of a grout plug to avoid prolonged schedule delays.
Therefore, given the previous undesirable tunnelling experience within the Mayo A tunnel, this alternative was rejected.
The third alternative required a tie-in and modification of the existing Mayo A intake, with construction of a 300m-long bedrock tunnel, and a 3.2m-diameter, steel penstock approximately 3.6km in length (Figures 2 and 3).
By using this arrangement, the modified intake would be common to both the Mayo A and Mayo B hydro plants. The steep rock slope on the reservoir shore at the intake, combined with the depth and design of the intake, made dewatering of the existing intake very challenging, and even more so for construction of a new intake. The reuse and tie-in to the existing Mayo A intake had construction risk, but also significant overall cost savings. This alternative was ultimately approved on the basis of relatively low associated construction risk, suitable access, and competitive construction cost, as compared to the alternatives examined.
CONTRACTUAL ARRANGEMENT
KGS Group consulting engineers (KGS) from Winnipeg, Manitoba, and Peter Kiewit Infrastructure Group (PKI), were the prime consultant and contractor to YEC. KGS and their subconsultants were responsible for overall project design and quality control during construction. PKI was responsible for all construction activities, as well as for the contractual arrangements with their subcontractors.
Several challenges were addressed while planning and constructing the Mayo B project. These included a short construction season due to the cold weather, discontinuous permafrost areas, and other logistical hurdles such as long transportation routes, and timely availability of equipment and materials. Recognising these challenges, and in order to minimise construction risks, YEC and KGS engaged PKI in the project during the planning and design stages. Thus, the experience gained in the early stages of the project enabled the construction teams to meet the challenges associated with a remote site in a sub-arctic climate. The finances for the project were jointly provided by the governments of Canada and Yukon Territory. The total estimated construction cost of the project was in the order of CAD 100M (USD 87M). Mayo B created more than 60 direct jobs for Yukoners during construction, and also provided spin-off benefits to about 120 Yukon businesses.
CONVEYANCE SYSTEM DESIGN
The Mayo B project has a common intake with the existing Mayo A plant. The two systems (Mayo A and Mayo B) bifurcate approximately 10m downstream of the intake gate.
From the bifurcation, the Mayo B tunnel advances for about 300m, where it then transitions to the steel penstock (Figures 2 and 3). The design flow for the Mayo Complex (Mayo A and Mayo B Generating Stations) is 25m3/s. These flows correspond to 6m3/s minimum flows in Mayo A and 19m3/s to Mayo B. The tunnel is a 3.5m by 4m horseshoe or inverted "U" by design. A survey of the tunnel cross section shows an average flow area of 16m2, and an average hydraulic radius of 1m. The Darcy-Weisbach friction factor was estimated to be 0.054 (minimum) to 0.29 (maximum), including friction and form losses.
The buried steel penstock is circular, with an internal diameter of 3.2m, and wall thickness of 12.7mm. The Darcy- Weisbach friction factor is 0.0104 minimum, and 0.0285 maximum. The penstock is designed for a maximum surge increase of 35 per cent above static pressure.
The penstock conveyance also includes a surge facility. This reduced surge pressures on the penstock, but also enhanced unit operation. It consists of an arrangement of two inclined pipes, laid at 90o to the penstock and extending up the penstock route cut slope, on a naturally occurring high elevation ridge. Air from the surge facility is expelled through a heated vent, with a top elevation of approximately El. 598m, or approximately 23m above the typical reservoir level.
TUNNEL PORTALS Intake rockslope
Immediately behind the existing intake structure, a 25m to 30m high bedrock cliff, including areas of overhanging rock, was present. Inspections and observations of the rock slope conditions began as early as 1979, with inspections and localised works completed during the mid-1990s (by others).
The rockslope inspections during 2007/2008 and 2010 revealed that the slope consisted of well-jointed, fractured, and blocky rock. The bedrock slopes are controlled by bedrock structure, consisting of schistosity (foliation bedding) and at least two major joint sets, with generally subvertical to vertical dips toward the reservoir. Predominant joint set discontinuities include AZ 202o to AZ 262o, dipping 63o to 90o to the northwest; AZ 290o to AZ 325o, dipping 60o to 75o to the northeast; AZ 277o to AZ 346o, dipping 88o to 90o to the northeast; and schistocity striking AZ 22o to AZ 80o, dipping 9o to 30o to the southeast (i.e. into the rock face). Bedding thicknesses were typically <25mm and up to 600mm, with joints at sub-meter to 5 to 10m spacing.
Open vertical joints were noted in the rock face on both sides of the intake structure. Frost penetration measured up to 6m depth within the rock face likely played a role in widening and deepening the open joint zones. Additionally, differentially weathered and highly altered chloritic bedrock zones, formed along the predominant schistocity of the rock, were noted at distinct elevations within the rock face at El. 582m +/- and at El. 590m +/- (reservoir El. 575m +/-). Along with the predominant jointing within the bedrock, these "soft" friable bedrock zones created undermined, overhanging conditions at the rock face as well as weak bearing surfaces supporting the columns of detached bedrock above them.
With the bedrock blocks partly disjointed and unstable, inspections identified both potential for toppling and wedge/overhanging rock failures.
Stabilising the intake rock slope presented several difficulties and risks to the operations of the intake structure. Failure to successfully remove loose blocks and grade back the soil and rock slopes above the intake could have resulted in catastrophic collapse of rock mass protracting Mayo B construction delays and costly repairs of the intake structure.
Two alternatives were evaluated for stabilisation of the rock face and associated overhangs, including controlled line drilling with light explosive charges, or benching by scaling. The contractor opted for the latter option, using heavy equipment to perform scaling and benching. Blasting proved unnecessary due to the highly fractured and weak nature of the rock. A machine excavated "sinking cut" of approximately 3m to 3.5m was advanced well behind the rockslope face, followed by pulling back of the rock slope face into the sink cut area, using a hydraulic excavator. Rock materials were stripped back into the sink cut along foliation.
Downstream portal
A steep soil slope exists above the bedrock at the downstream portal area. Evidence of sloughing and sliding of the slope was noted in test excavations conducted during design investigations at the rock slope, associated with the proposed portal area. Unlike at the intake area, the schistocity of the rock at the downstream portal dips out of the rock slope face. A limited number of discontinuity measurements were collected on the rock slope at the downstream portal. Bedrock structure included at least three steeply dipping sub-vertical joints, and a strong schistocity (foliation). Portal stabilisation works required construction of a series of access roads and benches on the slope, then proceeding with stabilisation work from the top down. Design of the portal stabilisation was by Golder Associates, for PKI.
The area surrounding portal opening was stripped down to bedrock, and then reinforced. A series of 6m long, 25mm diameter fully grouted threadbars in a 3m by 2m, offset row pattern were installed on the upper slope, completed with wire mesh and 50mm of shotcrete. The lower slope included 6m long, 25mm diameter fully grouted threadbars on a 2m by 2m pattern, with 2m-long split sets installed split-spaced between each grouted threadbar. Wire mesh and a 50mm layer of shotcrete completed the slope works. Once the invert of the slope was reached, a series of 4m long, 25mm diameter fully grouted threadbar spilings were installed above the tunnel crown. Steel sets and lagging were also installed to create a canopy, once the tunnel was initiated.
TUNNEL CONSTRUCTION Structural geology
The predominant schistocity of the bedrock dips out of the tunnel face, with dips up to 30o. As such, the design assumption was that there would be tendencies for rock to fall out, in particular when encountering chlorite schist layers, or where wide zones of weaker quartz-mica schists to phyllites were prominent. The impact of these bedrock zones on the tunnel overbreak conditions was considered during design. Three primary sets of joints were anticipated along the tunnel drive (tunnel drive approximately AZ 333o).
Predominant joints were perpendicular to the tunnel (striking AZ230o to AZ250o, dipping 70o to 90o) and another striking at approximately 45o to the proposed tunnel alignment (AZ285o to AZ320o, dipping 70o to 90o). The third predominant set is parallel to bedding (foliation, striking AZ18o to AZ50o, dipping 10o to 40o. In addition, several persistent, gouge-filled shear zones were identified, including those along foliation (striking AZ06o to AZ40o, dipping 30o to 60o), and others striking AZ315o to AZ335o, dipping 35o to 55o. Other joints and fracture sets of lesser persistence (i.e. <1 m) were identified during tunnel mapping, but are not detailed here. There were no indications for any swelling characteristics of the rock.
Rock strength and stresses
The rock along the tunnel alignment was classified as weak to medium strong rock. Several core samples were tested for uniaxial compression strength (UCS) during the 2008 exploratory programs. One compression test yielded 88MPa strength, while another test failed on a pre-existing joint, yielding 26.5MPa strength. During the 2009 exploration program, additional core samples were subjected to Point Load tests, producing strengths in the range of 2.8MPa to 33MPa.
In-situ stress measurements were not carried out in the project area. Based on the project configuration, tunnelling depths, and bedrock morphology/site conditions, it was anticipated that the in-situ stress condition in the tunnel zone was not going to be problematic for construction of the power tunnel. Observations during tunnelling did not reveal signs of predominant stress relief along the tunnel crown/walls, such as spalling.
Tunnel support
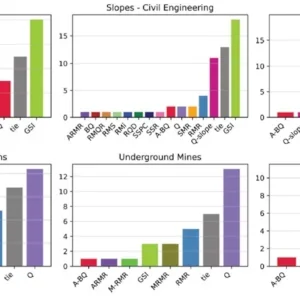
In order to provide an index of the relative behaviour of rock mass, the RMR system (Bieniawski 1976 and 1988) was used. The analyses of RMR, based on the exploration boreholes drilled during 2008 and 2009 identified the need for the following classes of rock support:
Type 1 represents ground conditions corresponding to the best rock quality, having uniaxial compressive strength (UCS) in the range of 75MPa, with the RQD = 50 to 75 per cent. The resulting RMR value for a drill and blast method is 65, corresponding to "good" quality rock. Recommended initial support for this rock type consisted of 2m long resin bolts; at 1.3m spacing normal to tunnel axis and 2m spacing along tunnel axis.
Type 2 represents ground conditions corresponding to rock formation having UCS less than 75MPa, RQD = 25 to 50 per cent, and the resulting RMR for drill and blast is 50, corresponding to "fair" quality rock. The main difference between Types 1 and 2 is the spacing of the horizontal joints. Recommended initial support consisted of 2m long resin bolts; installed as per Type 1, with shotcrete as required.
Type 3 represents ground conditions corresponding to "poor" quality schist, having UCS as low as 1MPa, RQD less than 25 per cent, and discontinuities (joints and beds) spaced less than 60 mm. The resulting RMR for drill and blast is 25, corresponding to poor rock. It was determined that the rock of this category would likely have short stand-up time and would produce significant overbreak. Recommended initial installed support consisted of 2m long resin bolts installed on a 1.25m by 1.25m pattern accompanied by 50mm of shotcrete. In all cases, spot bolting was added where required in the field, as directed by the Contractor’s engineer. In addition, grouted spilings, plus structural steel sets at 1.2m spacing were installed within the first 15m of the tunnel.
Lagging and timbers were used to bridge and support the rock between the steel sets, to control loose ground, or ground that could be difficult to shotcrete.
Tunnel excavation
Excavation was by conventional drill and blast method with the Contractor using a two-boom, truck mounted jumbo. It was determined that this construction method would have the lowest unit cost and would have the greatest probability of successfully achieving the desired construction progress for the site ground conditions. Furthermore, it was concluded that this method could take advantage of the existing experience and skill sets held by the Contractor’s (Procon/ Na-Cho Nyak Dun joint venture) labour force.
Orica Canada supplied all explosives and other blasting accessories for the project. In an attempt to keep overbreak and blast damage at the portal to a minimum, the initial blast rounds were short, and fired with highly accurate eDevTM electronic detonators. As the tunnel advanced into more competent rock, non-electric ExelTM LP detonators were used. Programmable electronic detonators were used again as the excavations reached tie-in structure (closest to the intake and reservoir). All blast holes were 38mm in diameter, primed with Geldyne dynamite. Sticks of Geldyne cartridges were placed behind the primer and tamped (averaging eight cartridges per 3.5m-long drill hole). A 300mm unloaded collar was allocated for each blast hole to ensure that the likelihood of undetonated explosives in the muck pile was minimised. Perimeter holes were primed with Geldyne cartridges, 32 by 400mm size and then loaded with Xactex (19 by 600mm). The "burn cut" for the production rounds consisted of three unloaded 75mm reamer holes. Amex was often used in production holes during general tunnel advancement as well.
The excavation sequence consisted of drilling, explosive loading, mucking and installation of rock support (advancing in approximately 3m increments). A typical time-cycle of excavation is shown in Figure 4. Excavation works were conducted 20 hours per day on a two-shift basis from June 2010 to October 2011. Tunnel operations were suspended between Nov 2010 and May 2011, for winter shutdown. A groundwater monitoring program was instituted during shutdown, consisting of the drilling of three horizontal probe holes, advanced at the tunnel face, to 5m, 10m, and 20m depth, and a fourth, 10m-long hole at a 10o decline angle. Initial measurements indicated that flow from the holes, with all holes open, was approximately 140 L/min. Subsequent readings indicated that the flows from the probe holes were gradually decreasing, suggesting that the flows had reached a "steady state" condition. Observations continued through the shutdown period to ensure that a "steady state" seepage condition remained. Construction of the tunnel resumed in the spring of 2012.
Tie-in intake transition Excavation
The tie-in transition excavation was rectangular and approximately 6m by 5m in size, in order to allow for placement of concrete formwork and steel for construction of the transition. Initially, the contractor proposed to perform the excavation work by a pilot and slash method (Figure 5).
As the work progressed, the blasting operations were re-adjusted to accommodate the overall weak rock structure, and to prevent damage to the existing Mayo A tunnel liner. As the intake could not be dewatered, all tunnel and tie-in work was performed with the intake gate in place and with reservoir pressure on the gate. Measures taken to address concerns included frequent probe hole drilling, the use of precision electronic detonators, and a specific controlled blasting plan. Mechanical excavation was required near the existing concrete liner. Blast monitoring was strictly enforced, particularly when the tunnel was approaching the tie-in, to determine if amplification of blast vibrations was occurring at the existing concrete intake/tunnel structures.
Frequencies of 50Hz to greater than 100Hz were desirable and were generally achieved. Examples of monitoring data from the existing intake concrete structure, spillway structure, and intake structure bedrock, are presented in Table 1.
Overbreak
The design specified that an acceptable average overbreak be kept to within 150mm. This was considered achievable, provided that light trim charges were used in the perimeter holes. Overbreak occurred mostly in the tunnel crown, often along individual chlorite schist layers, or along weak foliation/ shear zones. Deeper overbreak was evident in the areas where the tunnel intersected thin beds of phyllite at an oblique angle, or where the tunnel drive became essentially sub-parallel to the low dip of the bedrock formation foliation, in some cases resulting in wedge fall-out. In these cases, overbreak of 200mm to 300mm was common during the tunnel excavation. Excessive overbreak also occurred at locations where Amex explosive was extensively used. Some areas with significant overbreak were partially infilled with shotcrete to reduce hydraulic abruptness, and losses.
Tunnel shotcrete lining
The final tunnel lining was selected in accordance with the required tunnel hydraulics, as well as for long term tunnel stability requirements. The lining within the tunnel proper consists of 150mm thick, fibre-reinforced shotcrete. Drains were drilled through the shotcrete and into the bedrock formation within the tunnel crown, and within each sidewall, at approximately 5m intervals along the tunnel length. The drains were designed to allow for a reduction in hydrostatic pressure against the shotcrete liner, when the tunnel is in an unwatered condition. Approximately 150 drains were installed, complete with 1.3m long, 25mm diameter slotted Polyvinyl Chloride (PVC) pipes, epoxied into place within the shotcrete portion of the drilled holes.
It was thought that the portal, with its location in highly weathered bedrock, would tend to be more likely to suffer blast damage. Hence, the lining in this portion of the portal was designed to withstand higher anticipated stresses. In addition, a 30m long steel liner, with the annular space backfilled with concrete, was installed within the downstream end of the tunnel, to transition to the steel penstock.
The liner was also designed to mitigate any possible hydraulic fracturing of the downstream portal slope under emergency shutdown and surge conditions. A double grout ring, each ring comprised of eight holes, each hole offset from the others and approximately 2m deep, were drilled into the bedrock and grouted at the upstream end of the steel liner. These were completed prior to installation and final encapsulation grouting of the steel liner. A series of proof holes were also drilled and tested following initial grouting of the two offset grout rings, to verify grouting effectiveness within the bedrock at the downstream transition.
The intake transition (tie-in area) was constructed with 400mm to 600mm thick cast-in-place reinforced concrete, and was designed for full exterior hydrostatic pressure that may occur during tunnel dewatering and inspection. The concrete structure at the intake transition, and the encapsulated tunnel outlet steel liner, were also post grouted after curing, using Fuko injection hoses.
Seepage during tunneling
It was anticipated that the bedrock units, as observed during the initial site investigations, would not yield significant volumes of seepage during the tunnel drive. Water pressure testing of the bedrock within the tunnel zone, measured during investigation programs, varied between approximately 0 Lugeons (L) to approximately 15 L. The highest water takes were measured at the holes closest to the intake structure/tunnel tie-in and intake rock slope. At the time of investigations, the intake rock slope had not been scaled, and as such, testing of bedrock permeability characteristics could not be completed closer than approximately 30 m down-tunnel alignment from the existing intake tie-in location. At distances of 100 m or so from the intake tie-in, the takes were typically lower and between 0 – 1 L. This permeability variability was also reflected in the static groundwater levels at the exploration boreholes (see Figure3). The majority of the tunnel seepage observed occurred within approximately 50m of the tie-in structure area, being closest to the reservoir. Conventional grout curtains were installed once the excavation was within approximately 40m to 45m of the intake tie-in, as tunnel seepage volumes were increasing.
A series of nine overlapping grout curtains were emplaced, each installed by drilling a pattern of up to 12m long grout holes at specific angles into the tunnel face, as the tunnel excavation advanced to the tie-in. When approaching the tunnel tie-in area, and as noted during project investigations, reservoir-equivalent pressures were measured in the grout holes, indicating that open and reservoir connected fractures in the rock structure were present.
Many of these zones were successfully grouted during the advancement of the tunnel.
The amount of grout take for each hole was dependant on the joint conditions, and emplaced grout was allowed to set for a shift, or more. The following day (or shift), probe holes were drilled to examine the effectiveness of the previously completed grout curtain, prior to blast pattern drilling and loading.
In the event that seepage inflows from probe holes exceeded approximately 10 L/min to 15 L/min in total, additional grout holes were drilled and grouted prior to any further drilling and blasting. Overall, relatively minor seepage was observed in the tunnel proper (between the tunnel tie-in and downstream portal). Seepage was usually concentrated in rock bolt and probe/grouting holes, and was grouted as required, prior to advancing the next blast round.
Tunnel survey and mapping
Throughout the project, KGS utilised Topcon GR-3 survey grade receivers, Topcon total stations, and a Leica HDS C10 scan station to laser scan the inside of the Mayo B tunnel. Survey control established at the downstream tunnel portal was brought into the tunnel to allow for 3-D tunnel scanning using the Leica equipment, producing scans with a point density of 10mm to 15mm with an accuracy of 5mm to 8mm. Data from the tunnel scans was used to produce volume calculations, confirm alignments and tunnel geometry (particularly in 3-D space at the tie-in), produce as-constructed information, and to assist with field-based design modifications.
The KGS site engineer completed mapping of the tunnel geology after each blast. The geological sheet developed for the project represents a developed cylindrical view of approximately a 3m interval of tunnel. Each mapping sheet summarizes the component RMR values, including rock type(s). The collection of this data by KGS was primarily related to compilation of the as-built record of the tunnel for YEC.
Golder Associates performed mapping for PKI for determining and identifying all initial tunnel support requirements.
Review mapping of the tunnel as a whole, prior to final shotcrete installation, was completed at the end of the first construction season (November, 2010), and also during final construction phases of the tunnel during 2011. The compiled as-built tunnel condition mapping provides YEC a record that subsequent tunnel inspections may be compared to, even though the completed tunnel is lined with shotcrete.
CONCLUSIONS
The Mayo B hydroelectric project provides additional electricity to the Yukon Territory, hence displacing diesel generation that would otherwise be required to meet the various increasing electricity demands. Operation of the Mayo B facility offsets as much as ten million dollars in annual diesel fuel costs, and eliminates approximately twenty five thousand tonnes of greenhouse gas emissions per year. Planning and executing a construction project in remote regions of the Yukon Territory is challenging, primarily due to the cold-related short construction season and other logistic hurdles, such as the timely availability of equipment and material. Recognizing these challenges, YEC and KGS proceeded to engage the construction Contractor at the early stages of the project. The owner (YEC), designer (KGS and their subconsultants) and contractor (PKI, and their subcontractors) are credited for completing the project without significant overall delays or injuries. Careful planning, the use of precision survey tools, and input from subject matter experts in control blasting and grouting were key factors in the successful completion of tunnel tie-in. Mayo’s "alliance model" contracting experience could prove useful while planning other projects, in similar challenging environments. The project was designed and constructed in less than two years between preliminary design to first power. This schedule was only achievable due to close, continued communication and cooperation between YEC, KGS, PKI, and the various subcontractors and subconsultants involved with the project